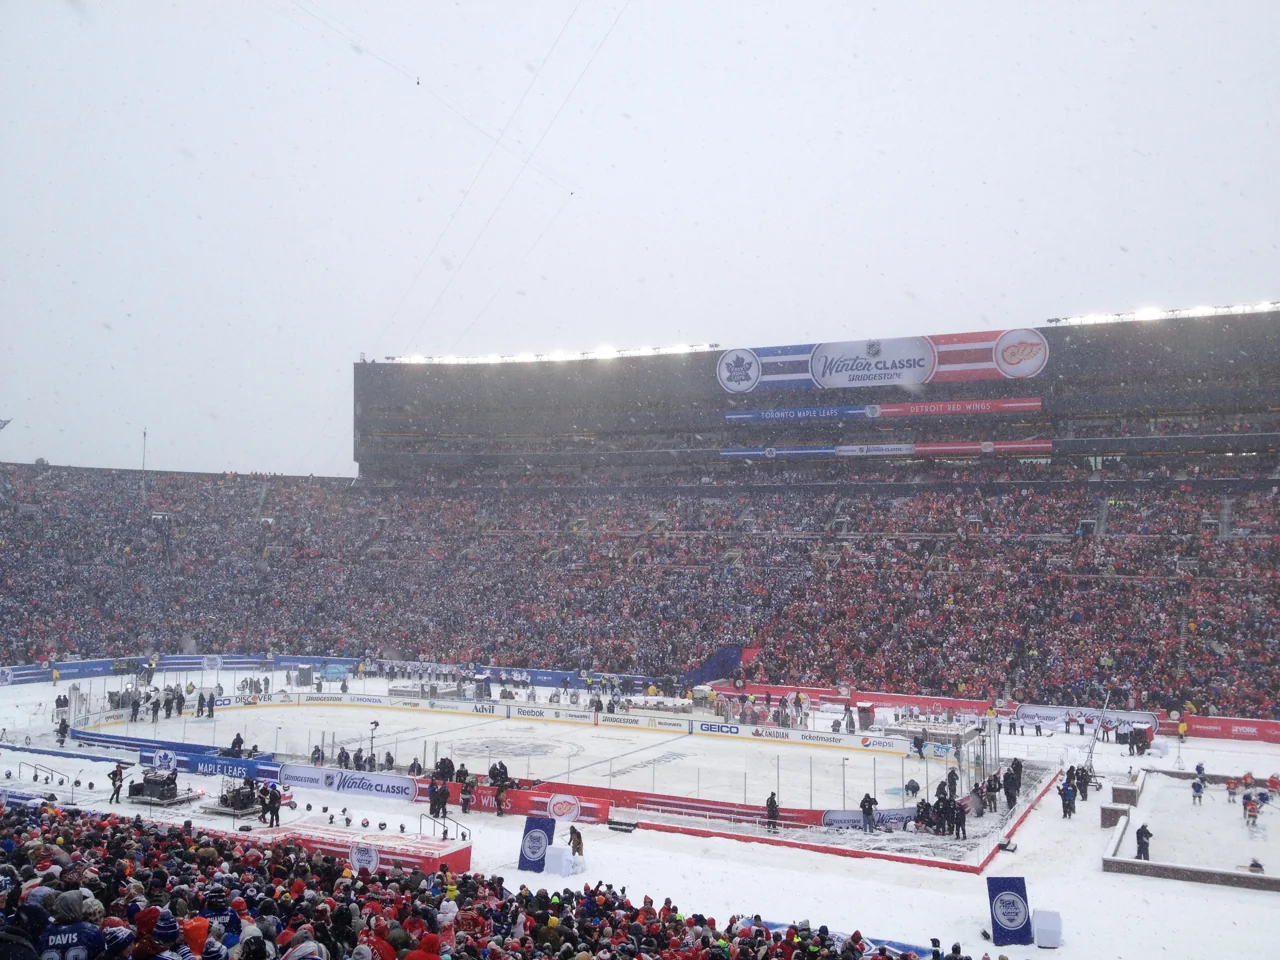
The NHL's historical register lists 2025-26 as the completed regular season with the largest total attendance: 23,158,522 across 1,312 games. The biggest single NHL crowd in the league's historical outdoor ranking was 105,491 at Michigan Stadium in 2014. Those records answer different questions. This guide compares all 80 season labels available in the official annual register, from 1946-47 through 2025-26, explains the calculated game averages, and places shortened schedules, restricted-attendance seasons and stadium events in context. Figures were checked November 10, 2026.
Cover photograph: the 2014 Winter Classic at Michigan Stadium before puck drop, by Matthew Barera, Wikimedia Commons, CC BY-SA 3.0; resized and converted to WebP.
Which NHL attendance record are you comparing?
The latest completed season in the official historical attendance register, checked November 10, 2026, is 2025-26. Its regular-season total is 23,158,522 across 1,312 games. That is the largest regular-season total in the register. It is a different record from the largest crowd at one game, the highest average crowd per game, or the combined audience for regular-season and playoff games.
The NHL historical attendance register separates regular-season attendance, playoff attendance and their combined total. Keep those categories intact. For 2025-26, adding 1,517,547 playoff spectators produces a combined figure of 24,676,069. Calling that the regular-season audience would inflate the comparison by including a different phase of the competition.
Per-game attendance answers another question. Divide the regular-season total by the number of regular-season games to describe the average crowd at one event. A total can increase because the league stages more games, because the typical crowd gets larger, or through a combination of both. The annual table below therefore includes the game count and a calculated average beside the total.
These are cumulative game attendances, not a census of distinct people. A supporter attending ten games contributes to ten event counts. The numbers also do not measure television audiences or establish ticket revenue. The NHL's 2024-25 record announcement, for example, explicitly excluded the separate 4 Nations Face-Off tournament.
Finally, treat the ongoing 2026-27 season as an incomplete sample. An early-season figure belongs in a dated current-season comparison, not beside completed annual totals as if it represented the same amount of hockey. A historical record needs a defined competition, season and denominator before its headline number becomes meaningful.
NHL regular-season attendance by year
The table reproduces the annual regular-season totals and game counts in the NHL's historical register, with averages calculated by dividing each total by its game count. The available series begins in 1946-47 and ends in 2025-26. It does not claim to cover the league's earlier seasons. A season label refers to the NHL competition spanning those years, rather than a January-to-December calendar-year audience.
Two different leaders emerge. The largest total is 23,158,522 in 2025-26. The highest calculated game average within this register is approximately 17,768 in the shortened 2012-13 season, from 12,792,723 across 720 games. The latter season had a much smaller cumulative audience because it offered far fewer games. A headline that says only attendance record can obscure that distinction.
| Season | Games | Reported attendance | Calculated average |
|---|---|---|---|
| 2025-26 | 1,312 | 23,158,522 | 17,651 |
| 2024-25 | 1,312 | 23,014,458 | 17,542 |
| 2023-24 | 1,312 | 22,873,142 | 17,434 |
| 2022-23 | 1,312 | 22,436,532 | 17,101 |
| 2021-22 | 1,312 | 20,784,346 | 15,842 |
| 2020-21 | 868 | 1,004,925 | 1,158 |
| 2019-20 | 1,082 | 18,835,275 | 17,408 |
| 2018-19 | 1,271 | 22,186,851 | 17,456 |
| 2017-18 | 1,271 | 22,174,362 | 17,446 |
| 2016-17 | 1,230 | 21,545,024 | 17,516 |
| 2015-16 | 1,230 | 21,615,397 | 17,573 |
| 2014-15 | 1,230 | 21,533,419 | 17,507 |
| 2013-14 | 1,230 | 21,758,902 | 17,690 |
| 2012-13 | 720 | 12,792,723 | 17,768 |
| 2011-12 | 1,230 | 21,468,141 | 17,454 |
| 2010-11 | 1,230 | 21,113,926 | 17,166 |
| 2009-10 | 1,230 | 20,996,455 | 17,070 |
| 2008-09 | 1,230 | 21,475,223 | 17,460 |
| 2007-08 | 1,230 | 21,236,255 | 17,265 |
| 2006-07 | 1,230 | 20,861,787 | 16,961 |
| 2005-06 | 1,230 | 20,854,169 | 16,955 |
| 2004-05 | No season | ||
| 2003-04 | 1,230 | 20,356,199 | 16,550 |
| 2002-03 | 1,230 | 20,408,704 | 16,592 |
| 2001-02 | 1,230 | 20,614,613 | 16,760 |
| 2000-01 | 1,230 | 20,373,379 | 16,564 |
| 1999-00 | 1,148 | 18,800,139 | 16,376 |
| 1998-99 | 1,107 | 18,001,741 | 16,262 |
| 1997-98 | 1,066 | 17,264,678 | 16,196 |
| 1996-97 | 1,066 | 17,640,529 | 16,548 |
| 1995-96 | 1,066 | 17,041,614 | 15,987 |
| 1994-95 | 624 | 9,233,884 | 14,798 |
| 1993-94 | 1,092 | 16,105,604 | 14,749 |
| 1992-93 | 1,008 | 14,158,177 | 14,046 |
| 1991-92 | 880 | 12,769,676 | 14,511 |
| 1990-91 | 840 | 12,343,897 | 14,695 |
| 1989-90 | 840 | 12,579,651 | 14,976 |
| 1988-89 | 840 | 12,417,969 | 14,783 |
| 1987-88 | 840 | 12,117,512 | 14,426 |
| 1986-87 | 840 | 11,855,880 | 14,114 |
| 1985-86 | 840 | 11,621,000 | 13,835 |
| 1984-85 | 840 | 11,633,730 | 13,850 |
| 1983-84 | 840 | 11,359,386 | 13,523 |
| 1982-83 | 840 | 10,940,610 | 13,025 |
| 1981-82 | 840 | 10,710,894 | 12,751 |
| 1980-81 | 840 | 10,726,198 | 12,769 |
| 1979-80 | 840 | 10,533,623 | 12,540 |
| 1978-79 | 680 | 7,758,053 | 11,409 |
| 1977-78 | 720 | 8,526,564 | 11,842 |
| 1976-77 | 720 | 8,563,890 | 11,894 |
| 1975-76 | 720 | 9,103,761 | 12,644 |
| 1974-75 | 720 | 9,521,536 | 13,224 |
| 1973-74 | 624 | 8,640,978 | 13,848 |
| 1972-73 | 624 | 8,575,651 | 13,743 |
| 1971-72 | 546 | 7,609,368 | 13,937 |
| 1970-71 | 546 | 7,257,677 | 13,292 |
| 1969-70 | 456 | 5,992,065 | 13,140 |
| 1968-69 | 456 | 5,550,613 | 12,172 |
| 1967-68 | 444 | 4,938,043 | 11,122 |
| 1966-67 | 210 | 3,084,759 | 14,689 |
| 1965-66 | 210 | 2,941,164 | 14,006 |
| 1964-65 | 210 | 2,822,635 | 13,441 |
| 1963-64 | 210 | 2,732,642 | 13,013 |
| 1962-63 | 210 | 2,590,574 | 12,336 |
| 1961-62 | 210 | 2,435,424 | 11,597 |
| 1960-61 | 210 | 2,317,142 | 11,034 |
| 1959-60 | 210 | 2,386,970 | 11,367 |
| 1958-59 | 210 | 2,314,533 | 11,022 |
| 1957-58 | 210 | 2,216,237 | 10,554 |
| 1956-57 | 210 | 2,187,785 | 10,418 |
| 1955-56 | 210 | 2,127,843 | 10,133 |
| 1954-55 | 210 | 1,910,152 | 9,096 |
| 1953-54 | 210 | 1,950,146 | 9,286 |
| 1952-53 | 210 | 2,044,972 | 9,738 |
| 1951-52 | 210 | 1,908,032 | 9,086 |
| 1950-51 | 210 | 2,029,225 | 9,663 |
| 1949-50 | 210 | 2,361,059 | 11,243 |
| 1948-49 | 180 | 2,296,101 | 12,756 |
| 1947-48 | 180 | 2,398,475 | 13,325 |
| 1946-47 | 180 | 2,403,110 | 13,351 |
Source: NHL Records attendance history. The register leaves the canceled 2004-05 season without numerical attendance entries. Its average is therefore not shown as zero: there was no season from which to calculate a game average.
The four most recent seasons each contain 1,312 regular-season games. Their successive totals rise from 22,436,532 in 2022-23 to 23,158,522 in 2025-26. Because the event count is unchanged across those four rows, that particular rise also represents a higher average audience per game. Between 2024-25 and 2025-26, the increase is 144,064, or roughly 0.6 percent.
The NHL announced the 2024-25 figure as a record at the time. The newer completed-season entry supersedes it for total attendance, while the earlier announcement remains a valid account of its own date. Historical articles and search results can preserve the older headline long after a later season has established a new mark.
Keep the source scope when reusing a row. A club-by-club table that excludes overseas or outdoor dates can have a different denominator and total from the league's complete regular-season register. Similarly, a combined regular-season and playoff number cannot be substituted into this table. These annual figures are most useful when the same competition and event definition remain consistent from one comparison to the next.
Why season length changes the historical comparison
The annual series has several breaks that should be labeled before anyone uses it as a popularity chart. A lower total can follow a smaller schedule even when the average game remains well attended. Conversely, restoring canceled games can produce a large increase in the cumulative audience without proving an equally large improvement in demand for each available night.
Lockouts reduced or erased the schedule
The register lists 624 regular-season games for 1994-95 and 720 for 2012-13. The latter followed the 2012 lockout: a Bureau of Labor Statistics analysis documents the shortened season. Each club played 48 games, beginning January 19, 2013. That reduced schedule changes the attendance comparison before ticket demand even enters the discussion.
In 2011-12, the register records 1,230 games and 21,468,141 spectators. In 2012-13, there were 510 fewer games and a total of 12,792,723. Yet the calculated average rose to the highest figure in this historical series. The lower total and higher game average are compatible. Neither number alone provides a complete description of what happened to the league's audience.
The 2004-05 interruption is a different case. The entire season was lost, as described in the contemporaneous labor-history review. There is no set of played NHL games from which to calculate an annual crowd average. Keeping a no-season label preserves that distinction. Treating the blank as an ordinary zero-attendance season would confuse the absence of competition with games played in empty buildings.
Pandemic seasons need their own context
The 2019-20 regular season ended after 1,082 games. The historical register assigns those games 18,835,275 spectators, or roughly 17,408 per game. Using a full schedule's game count instead would understate the average of the games actually played.
The next season involved a more fundamental access limitation. The NHL's 2020-21 schedule announcement described a 56-game season per team and anticipated that most arenas would initially be unable to admit fans. The register's 1,004,925 across 868 games produces an average of about 1,158. That denominator includes all regular-season games, rather than only games admitting spectators.
This figure cannot be read as the crowd an unrestricted NHL game would have attracted. Access conditions constrained the opportunity to attend. Comparing it directly with a normal season as a measure of voluntary fan interest would ignore the central difference between the samples.
For a historical chart, mark shortened schedules, canceled seasons and restricted-attendance periods visibly. Keep the original annual totals, but explain the disruption beside them. A smooth line without those labels can make a scheduling or access shock look like an ordinary movement in fan interest, while hiding why the numbers changed.
The biggest NHL game crowds are outdoor records
A season accumulates audiences over hundreds of events. A single-game record measures one gathering. Outdoor games can bring hockey into venues with far more spectator space than the clubs' usual arenas, creating a separate scale of crowd record. Those events belong in the season's attendance accounting when they are regular-season fixtures, but their size should not be mistaken for an ordinary indoor home crowd.
The NHL's 2026 Stadium Series guide ranks the historical outdoor crowds. Its leading entries are Michigan Stadium, Ohio Stadium and the Cotton Bowl. The corresponding official Game Summaries independently identify the attendance, venue and date for each event below.
Michigan Stadium and the next largest crowds
| Date | Matchup | Venue | Reported crowd |
|---|---|---|---|
| January 1, 2014 | Toronto at Detroit | Michigan Stadium | 105,491 |
| March 1, 2025 | Detroit at Columbus | Ohio Stadium | 94,751 |
| January 1, 2020 | Nashville at Dallas | Cotton Bowl Stadium | 85,630 |
The Michigan Stadium Game Summary, Ohio Stadium report and Cotton Bowl report provide the original figures. Michigan's reported crowd exceeds Ohio's by 10,740. That is a comparison of those recorded events, with no need to estimate attendance from television pictures or stadium seating photographs.
Use the NHL record's own definition when discussing Michigan's mark. An announced NHL crowd and an independently certified world record need not use identical verification procedures. This guide uses the official NHL attendance entry; it does not substitute that number for a separately audited headcount or make a claim about every hockey competition in the world.
An outdoor fixture can also lift a designated home team's annual average. To measure the effect on its ordinary arena crowds, compare the home sample with and without that date and label both versions. Do not simply add a stadium crowd to a season total that already includes the game. The same spectators would then enter the calculation twice.
The venue and event are therefore essential context beside the record. A club drawing a stadium audience on one special date has demonstrated the scale of that event, rather than an ability to fit the same audience into its indoor rink every week. Our NHL outdoor games guide covers the event setting separately from this annual attendance history.
Expansion and arenas change what a league total means
The NHL doubled from six teams to twelve in 1967-68. The attendance register shows the event count rising from 210 to 444 between those seasons. Total attendance climbed from 3,084,759 to 4,938,043, while the calculated game average fell from about 14,689 to 11,122. The league reached a larger combined audience across a much larger set of games, with a different mix of markets and venues.
That example shows why growth in total attendance and growth in the typical game crowd are separate statements. It does not establish that every existing club drew fewer people after expansion. To test that question, compare the same clubs and their home dates before and after the change. A league average combines the old and new members, so the composition of the league itself influences the result.
Later additions also changed the available schedule. The register moves from 1,230 games in 2016-17 to 1,271 in 2017-18. The NHL's 2021-22 announcement identified Seattle as the thirty-second franchise and specified 1,312 games. With an equal schedule, multiplying clubs by games per club and dividing by two produces the event count: each actual game involves two teams, but only one crowd.
Winnipeg shows why arena history belongs beside the numbers
A venue's identity also needs to remain consistent across older records. The October 9, 2011 Winnipeg report lists 15,004 at MTS Centre. That entry belongs to its own game and arena configuration. It should not be adopted automatically as the building's capacity for a different season.
The owner's True North history records the change from MTS Centre to Bell MTS Place in 2017 and then to Canada Life Centre in 2021. A new name alone is not evidence of a new building. When comparing historical attendance, connect those names to the same physical venue before interpreting an apparent change in an arena table.

Capacity is another variable to attach to the season, not just the arena name. Seating configurations, renovations and exceptional home venues can alter the denominator used for a capacity percentage. A smaller building can fill its available places while reporting a lower raw crowd than a larger one. Ranking those clubs by headcount alone answers who reported more spectators, rather than who filled a larger share of comparable inventory.
For a practical venue cross-check, start with the NHL cities and arenas map, then return to the historical season's own documentation. Current names help locate a venue today; old game reports establish what was recorded for the earlier event. Keeping both identities prevents a renamed arena, a relocated club or a changed seating plan from becoming a misleading attendance trend.
Check an attendance claim against the original record
Begin by identifying exactly what the claim measures. For an annual league total, open the official attendance register and locate the season. For a single game, use its original Game Summary. For a club's home-season record, consult that club's season documentation and confirm whether the figure includes every designated home date or only games at its usual arena.
Then check the competition phase. The 2025-26 register offers a concrete test: 23,158,522 is the regular-season total, while 24,676,069 combines the regular season and playoffs. Both numbers can appear correctly in an article, provided their labels remain attached. A comparison becomes misleading when the combined figure from one year is placed beside the regular-season figure from another.
For an average-crowd claim, do the division using the source's actual game count. The shortened 2012-13 season supplies the useful counterexample to a total-only ranking. Its 720 games produced a higher calculated average within this register than the latest completed season, even though its cumulative attendance was much lower. Keep the unrounded total and denominator when calculating; rounding the displayed result should be the final step.
Check the publication date as well as the season label. An April 2025 announcement can correctly describe the record established in 2024-25 while a later register shows that 2025-26 surpassed it. An old record headline is not necessarily a factual error. It becomes an error if it is presented as the current mark without checking the newer completed seasons.
Next, look for exclusions and changes in the sample. Outdoor games, overseas games, restricted-admission events and a canceled season can all require a note. If two sources disagree, compare those definitions before deciding that one has counted incorrectly. A table of ordinary home-arena dates may be answering a narrower question than the league register.
The NHL team directory helps connect club names to current schedule pages, while today's NHL games provides a starting point for a recent event. Return to the original report for the attendance entry itself. A schedule identifies the event; it does not automatically verify the audience figure attached to a social-media post.
For sharing or citing a number, retain four pieces of information together: the metric, season or game date, event count where relevant, and original source. That makes the claim reproducible and allows a later reader to distinguish a new record from a revised definition. In this historical series, the total leader and the calculated average leader differ. Clear labels preserve both results without forcing them into one ambiguous record.
Comments
Comments are reviewed before publication. Spam, abusive content and policy-violating links are not published.
Sign in with Google to leave a comment.
Loading comments...