Montreal has the highest average reported crowd in this dated 2026-27 NHL attendance comparison, while Toronto has the largest total. The difference comes from both crowd size and unequal home schedules. Below is a complete 32-team table built from 285 official NHL Game Summaries for completed regular-season games dated through November 9, 2026, checked on November 10. Use it to compare reported home crowds, understand why capacity percentages need care, and separate ordinary arena nights from an outdoor event.
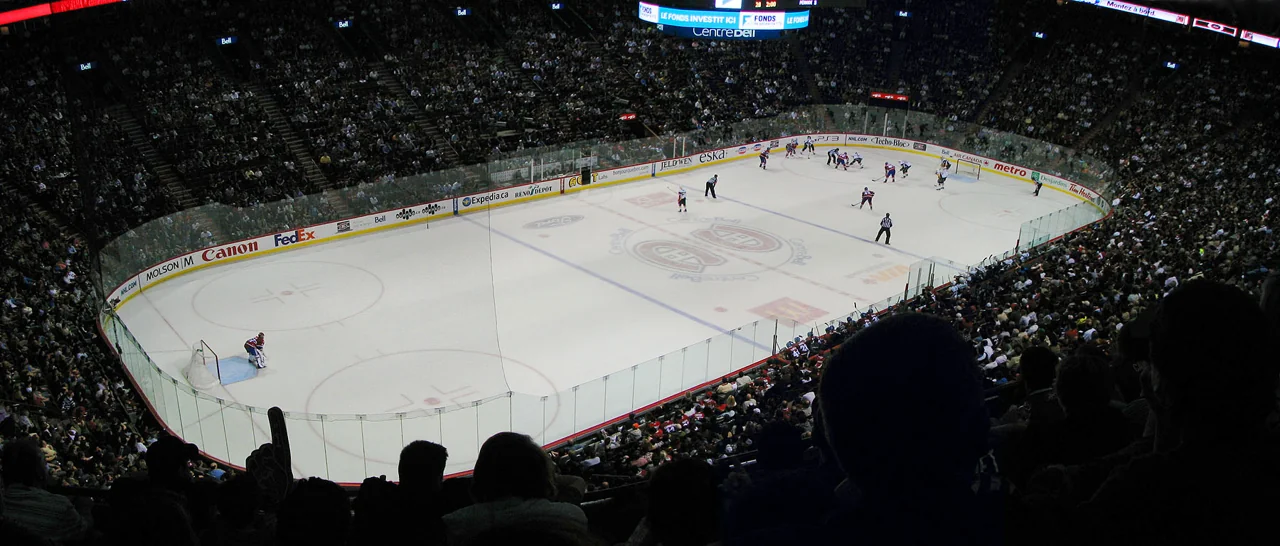
Cover photograph: Canadiens hockey at Bell Centre on April 3, 2010, by Datch78, Wikimedia Commons, CC BY-SA 3.0; resized and converted to WebP. Historical illustration, not a photograph of the current-season crowd.
What this 2026-27 attendance snapshot measures
This is a dated comparison of reported crowds at completed regular-season games, with a cutoff of November 9, 2026. It excludes preseason games, future dates and playoff games. It is not a live attendance feed, a count of season-ticket accounts or a survey of how many people were sitting in their seats at a particular moment.
The starting evidence is the NHL's official game summary. For example, the November 4 Calgary-Seattle report identifies the game, venue and reported attendance together. Keeping those fields connected makes a crowd number more useful than copying a figure from an undated table.
A home date belongs to the club designated as the home team on the league schedule. That is not necessarily a game inside its usual arena. This distinction becomes important when a team hosts an outdoor or neutral-site event. The assignment determines where the crowd enters the team total; the venue explains why that crowd might differ from an ordinary home night.
The comparison uses the games with an available attendance figure. A missing figure is not treated as an empty building and is not silently changed to zero. If a report is missing, its exclusion must remain visible so that the published average describes the actual sample. A complete-looking row is less useful than an honestly labeled one.
Read the table as a snapshot of this particular sample, rather than a final verdict on demand. Teams have played different numbers of home dates, against different opponents and at different times of the week. A crowd ranking also answers a different question from the current NHL standings. One measures reported attendance; the other measures competitive results. Neither should be substituted for the other when judging a club's season.
NHL attendance by team through November 9
Montreal leads this snapshot in average reported attendance, at 20,962 across nine home dates. Toronto has the largest cumulative crowd, with 207,752 across eleven dates. Those are different achievements: one measures the typical home crowd, while the other also reflects how many opportunities a club has had to host a game.
The table covers all 32 teams and 285 completed regular-season games dated through November 9, 2026. Every one of those games had a readable attendance entry when checked on November 10. Together they account for 4,995,913 reported spectators, or about 17,530 per game. A person attending several nights contributes to several game counts; this is not a count of unique individual fans.
| Rank | Team | Reported home games | Attendance total | Average |
|---|---|---|---|---|
| 1 | Montréal Canadiens | 9 | 188,658 | 20,962 |
| 2 | Florida Panthers | 6 | 115,925 | 19,321 |
| 3 | Tampa Bay Lightning | 8 | 152,736 | 19,092 |
| 4 | Buffalo Sabres | 9 | 171,630 | 19,070 |
| 5 | Toronto Maple Leafs | 11 | 207,752 | 18,887 |
| 6 | Carolina Hurricanes | 8 | 151,074 | 18,884 |
| 7 | Philadelphia Flyers | 10 | 186,239 | 18,624 |
| 8 | Dallas Stars | 10 | 185,320 | 18,532 |
| 9 | Minnesota Wild | 7 | 129,705 | 18,529 |
| 10 | Detroit Red Wings | 10 | 182,558 | 18,256 |
| 11 | Colorado Avalanche | 10 | 180,981 | 18,098 |
| 12 | Chicago Blackhawks | 9 | 161,244 | 17,916 |
| 13 | Boston Bruins | 9 | 160,650 | 17,850 |
| 14 | St. Louis Blues | 7 | 124,810 | 17,830 |
| 15 | New York Rangers | 10 | 177,445 | 17,744 |
| 16 | Washington Capitals | 11 | 192,615 | 17,510 |
| 17 | Vancouver Canucks | 9 | 156,914 | 17,435 |
| 18 | Calgary Flames | 10 | 173,041 | 17,304 |
| 19 | Edmonton Oilers | 11 | 189,656 | 17,241 |
| 20 | Nashville Predators | 11 | 189,120 | 17,193 |
| 21 | Seattle Kraken | 8 | 137,208 | 17,151 |
| 22 | Los Angeles Kings | 7 | 119,654 | 17,093 |
| 23 | Vegas Golden Knights | 9 | 153,367 | 17,041 |
| 24 | Pittsburgh Penguins | 8 | 135,869 | 16,984 |
| 25 | Anaheim Ducks | 8 | 133,932 | 16,742 |
| 26 | Winnipeg Jets | 9 | 145,729 | 16,192 |
| 27 | New Jersey Devils | 10 | 159,682 | 15,968 |
| 28 | Columbus Blue Jackets | 9 | 143,502 | 15,945 |
| 29 | Ottawa Senators | 8 | 125,712 | 15,714 |
| 30 | San Jose Sharks | 9 | 140,400 | 15,600 |
| 31 | New York Islanders | 9 | 138,119 | 15,347 |
| 32 | Utah Mammoth | 6 | 84,666 | 14,111 |
Source method: match completed games in the official NHL schedule feed to the attendance field in each NHL Game Summary. The Calgary at Seattle report illustrates that field. Games without a usable number would be disclosed separately rather than assigned zero; this snapshot has none.
These ranks are a dated comparison, not a continuously updating scoreboard. A team can move after its next home night, and an older table elsewhere may cover fewer games. San Jose, for example, has nine reported home dates here, including its November 9 game. Comparing that average with a source still showing eight games would mix cutoffs. Winnipeg also includes an outdoor designated-home game, so its row should not be read as nine ordinary nights inside the same arena.
Why average crowds and total attendance produce different leaders
A club can lead the league in accumulated attendance without drawing the biggest average crowd. Toronto's 207,752 spectators exceed Montreal's 188,658 in this sample, but Toronto has hosted eleven games to Montreal's nine. Montreal's average is therefore higher. Reading only the total would conceal that difference; reading only the average would conceal how many hockey nights each market has already supplied.
The home-date denominator
Average attendance is the reported crowd total divided by the number of reported home games. The denominator belongs beside the average because this early-season schedule is uneven. Clubs in this table have between six and eleven home dates. A short sample can be shaped heavily by opening night, an attractive opponent, a weekend, or one unusually large venue.
Florida and Utah both have six dates here, making their sample sizes equal, although their arena situations and schedules still differ. Florida's 115,925 total produces an average of about 19,321; Utah's 84,666 produces 14,111. That comparison describes the observed crowds. It does not establish why they differed, nor does it show how many additional spectators either building could accommodate.
Even the leader's average will change. As an arithmetic illustration, if Montreal's next home report were 18,000, its cumulative total would become 206,658 and its ten-game average would become about 20,666. That is a hypothetical calculation, not a prediction of an upcoming crowd. It shows why a rounded average should always travel with its date and game count.
A league average needs game weighting
To answer how many spectators the average NHL game drew, add every reported crowd and divide by every reported game. Here that is 4,995,913 divided by 285, giving approximately 17,530. Each game enters once under its designated home team. Adding the same crowd to both opponents and then treating those entries as separate events would double-count the audience.
Taking a simple mean of the 32 team averages instead gives about 17,505. That calculation gives a six-game club the same influence as an eleven-game club. It answers what the average club's average looks like, rather than what the average game drew. The difference is modest in this snapshot, but the method matters when the home schedule becomes more uneven or exceptional events appear.
Keep the original totals for these calculations. Multiplying rounded averages back by game counts can introduce small errors. For a later comparison, preserve the cutoff, completed-game count, missing-report count and event scope alongside the headline number. Otherwise an apparent attendance change might simply reflect a newer sample, additional home dates, or the inclusion of games that the earlier source excluded.
Capacity percentages need a venue check
A crowd of 17,000 means something different in an arena built for roughly that number than in one with more than 21,000 hockey seats. The Bell Centre describes its Canadiens configuration as seating over 21,000. A larger building gives a club more room to accumulate spectators, so a raw attendance ranking is not automatically a ranking of how fully teams use their available inventory.
Use hockey capacity rather than concert capacity
The basic calculation is attendance divided by the relevant capacity, multiplied by one hundred. The difficult part is choosing that denominator. A multipurpose venue can list different capacities for hockey, basketball and concerts. A concert can use floor space that holds the rink during hockey, while production equipment and seating configurations can also change the inventory. A generic maximum from an arena directory is insufficient for an exact game-by-game comparison.
Seattle provides a useful warning. The Climate Pledge Arena FAQ lists hockey capacity as 17,100. Seattle's eight home reports in this sample each list 17,151. Dividing that reported crowd by the FAQ figure produces about 100.3 percent. That mismatch alone does not explain how the two figures were assembled, or establish that the building exceeded an event's permitted occupancy.
Before publishing a precise utilization percentage, establish that the attendance numerator and capacity denominator cover the same inventory and event configuration. A season percentage across changing venues should use the sum of those game-specific capacities. Averaging event percentages can give the wrong weighting when one event has far more available places than another. This table therefore presents reported crowds without attaching an unverified capacity percentage to every club.
Outdoor and designated-home dates change the comparison
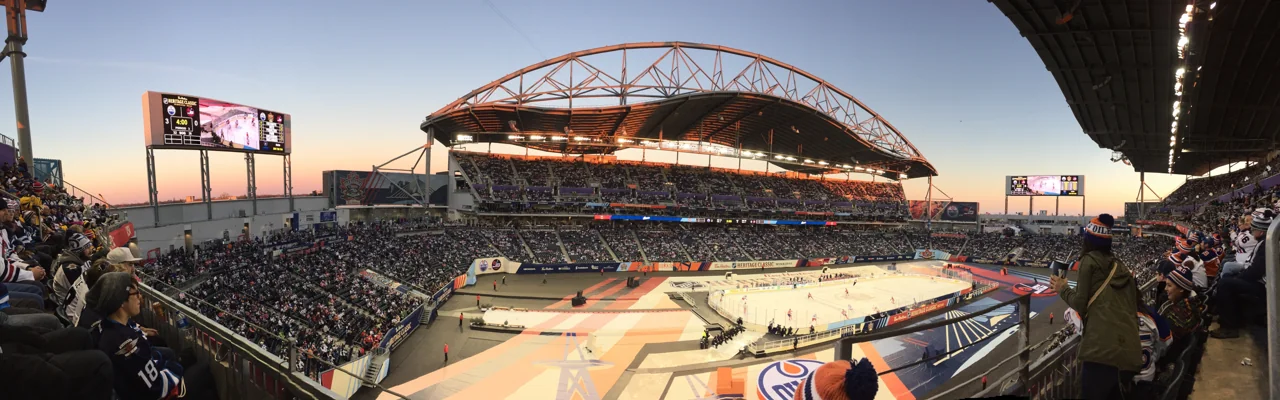
Winnipeg's row is especially sensitive to venue choice. Its October 25 Heritage Classic report records 32,343 at Princess Auto Stadium. That designated-home game belongs in the Jets' regular-season home total, even though it was played outside their usual indoor arena.
The Jets' nine-date average is about 16,192. Removing that outdoor event for a separate indoor-only view leaves 113,386 across eight dates, or about 14,173 per game. Both figures describe legitimate, clearly defined samples. The indoor-only number does not replace the club's home total; it answers a narrower question about the other eight nights. Dividing the mixed-venue average by one indoor capacity would blend two different settings.
For comparisons across markets, use the NHL team cities and arenas guide to identify the building, then check the event's own seating information. For an outdoor date, use the event configuration rather than the stadium's football capacity. The venue label is part of the attendance record, not an optional detail beside it.
What reported attendance cannot tell you about a crowd
The official reports establish the numbers recorded for the games in this table. They do not supply a public breakdown of ticket purchasers, complimentary admissions, scanned entries and unused tickets. Calling the column reported attendance keeps that limitation visible. It would go beyond these records to relabel every club's number as paid attendance or as a physical turnstile count under one verified league-wide method.
For a concrete example, the October 15 Edmonton Game Summary lists 16,176 at Rogers Place. That is a checkable entry. The report does not tell us how many attendees bought a single-game ticket, used a season ticket, received another form of admission, or were sitting in their assigned seat during a particular television shot.
Empty-seat photographs and paid attendance are different evidence
A ticket sold measures a purchase. A ticket distributed measures an issued admission under the source's definition. A scanned entry measures an entry recorded by the access system. A photograph shows a view at a moment in time. Those categories can overlap, but they are not interchangeable. Without the underlying definitions and records, subtracting one from another does not produce a defensible no-show rate.
A purchased seat can be empty if its holder does not attend. An attendee can be away from the seat when a camera passes. A photograph can show only part of the building. These are possible explanations for differences between visible occupancy and an announced figure; this dataset does not identify which explanation applies to any particular image or game. Counting blank patches in one cropped shot cannot recover the game's complete audience.
The same caution applies to revenue. Two games with identical reported attendance can have different ticket prices, seating mixes and purchase arrangements. Multiplying a crowd figure by one advertised ticket price is not a reliable gate-revenue calculation. Nor does one lower crowd prove that pricing, a team's results or a competing event caused the difference.
For a claim about a specific night, begin with its date, opponent, venue and original report. Then ask what additional evidence the claim needs. A statement about physical entries needs entry data; a statement about ticket sales needs sales data; a statement about demand over time needs comparable dates and a sufficiently broad sample. The crowd table supplies a useful starting point, while those further questions require evidence of their own.
Use the numbers to plan and compare hockey nights
Attendance is useful context when choosing a hockey trip, but the number you need for a purchase is the inventory for your actual game. Start with today's NHL games or the relevant team schedule, confirm the arena, and follow the club's official ticket route. A lower average crowd does not guarantee that the seats you want will be available for a popular opponent or a particular weekend.
Compare the complete cost for the same seating experience: ticket, fees, travel and any parking or accommodation you need. The NHL ticket prices guide can help structure that comparison. Do not turn a low attendance rank into an assumed discount. The reported crowd is historical evidence; the live offer for the specific seat and date is the relevant purchase information.
Check practical details directly with the venue. For example, Climate Pledge Arena's trip planner groups transportation, entrances, bag policy and accessibility information. Those details can matter more to a visiting fan than a few hundred places in an average-crowd ranking. If attending is impractical, consult the NHL television schedule for the matchup's viewing options.
For analysis rather than travel, build a comparison that can survive a change in the calendar. Keep the same regular-season scope, record each cutoff, show reported home games, and separate exceptional venues when the question calls for it. Compare a team's indoor sample with its indoor sample in another period before attributing a change to demand. A full league comparison should also account for the buildings and available inventory being compared.
To update this snapshot, add newly completed games from the official schedule, obtain their original attendance entries, and recompute totals and averages before changing any rank. Retain missing-report counts rather than filling gaps with assumptions. The table above remains a November 9 snapshot until that work is done. Its most useful lesson is visible in the two leaders: Montreal's larger average and Toronto's larger total can both be true when the home-date counts differ.
Comments
Comments are reviewed before publication. Spam, abusive content and policy-violating links are not published.
Sign in with Google to leave a comment.
Loading comments...