
The NHL playoff standings produce a 16-team field: eight clubs from the Eastern Conference and eight from the Western Conference. The top three finishers in each of the league's four divisions claim 12 places. The next two highest-ranked teams in each conference, regardless of division, take the four wild-card places.
The Short Answer: How the NHL Playoff Field Is Chosen
The league does not simply select the top 16 teams overall, and it does not take the top eight conference teams without considering divisions. Qualification happens in two passes:
- Lock in the top three from every division. The Atlantic, Metropolitan, Central, and Pacific each send three teams.
- Fill two wild cards in each conference. After removing those automatic division qualifiers, the two best remaining Eastern teams and two best remaining Western teams advance.
This design protects division races while still giving strong fourth- or fifth-place teams another route. Because wild cards are chosen across a conference, one division can send five teams while the other sends three. Four teams from each division is also possible. What cannot happen under the current rules is a division sending fewer than its top three.
Standings therefore answer three related but separate questions. Total points and tiebreakers determine order. Division position and conference wild-card order determine qualification. Once those positions are final, the NHL maps the teams into a fixed bracket. Reading the table correctly means keeping those steps in sequence instead of treating a wild-card label as a simple leaguewide seed.
How to Read an NHL Standings Table
A playoff race starts with points, but the surrounding columns explain how those points were earned and how securely a team holds its position. These are the labels that matter most:
| Column | Meaning | Why it matters |
|---|---|---|
| GP | Games played | Shows whether teams have played an equal schedule. |
| W | Total wins by any method | Every win adds two points, but total wins are only the fourth official tiebreaker. |
| L | Regulation losses | These add no standings points. |
| OT | Overtime or shootout losses | Each adds one point. |
| PTS | Standings points | The primary number used to order teams. |
| P% | Percentage of available points earned | Compares teams that have played different numbers of games. |
| RW | Regulation wins | The first win-based tiebreaker. |
| ROW | Regulation plus overtime wins | Excludes shootout wins and follows RW in the tiebreak order. |
| GF / GA | Goals for / goals against | Feed goal differential and later tiebreakers. |
| DIFF | GF minus GA | Used only after points, games played, three win measures, and head-to-head results fail to separate teams. |
The points formula is straightforward: multiply total wins by two, then add overtime or shootout losses. A 30-20-10 record is worth 70 points—60 from wins and 10 from the OT column. The regulation-loss column matters to the record, but contributes nothing directly to PTS.
Points percentage becomes important while the schedule is uneven. Divide points earned by the maximum points available through games played: PTS ÷ (2 × GP). A team with 70 points in 60 games has a .583 points percentage. A team with 71 points in 62 games has more raw points but a lower .573 percentage. The second club is ahead in the displayed points race; the first has performed better per available point and owns two games in hand.
That distinction disappears once every team has completed the same schedule length. Until then, read PTS and GP together. Then inspect RW and ROW so a points tie does not surprise you.
Division Berths and Wild Cards: Who Qualifies
The cleanest way to find the playoff field is to finish one conference at a time. In the East, take the top three Atlantic teams and top three Metropolitan teams. Then compare every remaining Eastern club and award WC1 and WC2 to the best two. Repeat the same process with the Central and Pacific in the West.
The wild-card pool ignores division after the automatic top-three places are removed. Imagine the Atlantic's fourth- and fifth-place clubs have 98 and 96 points, while the Metropolitan's fourth-place club has 94. The two Atlantic teams take both Eastern wild cards. The conference then sends five Atlantic teams and three Metropolitan teams. No balancing rule forces a fourth team from each division into the field.
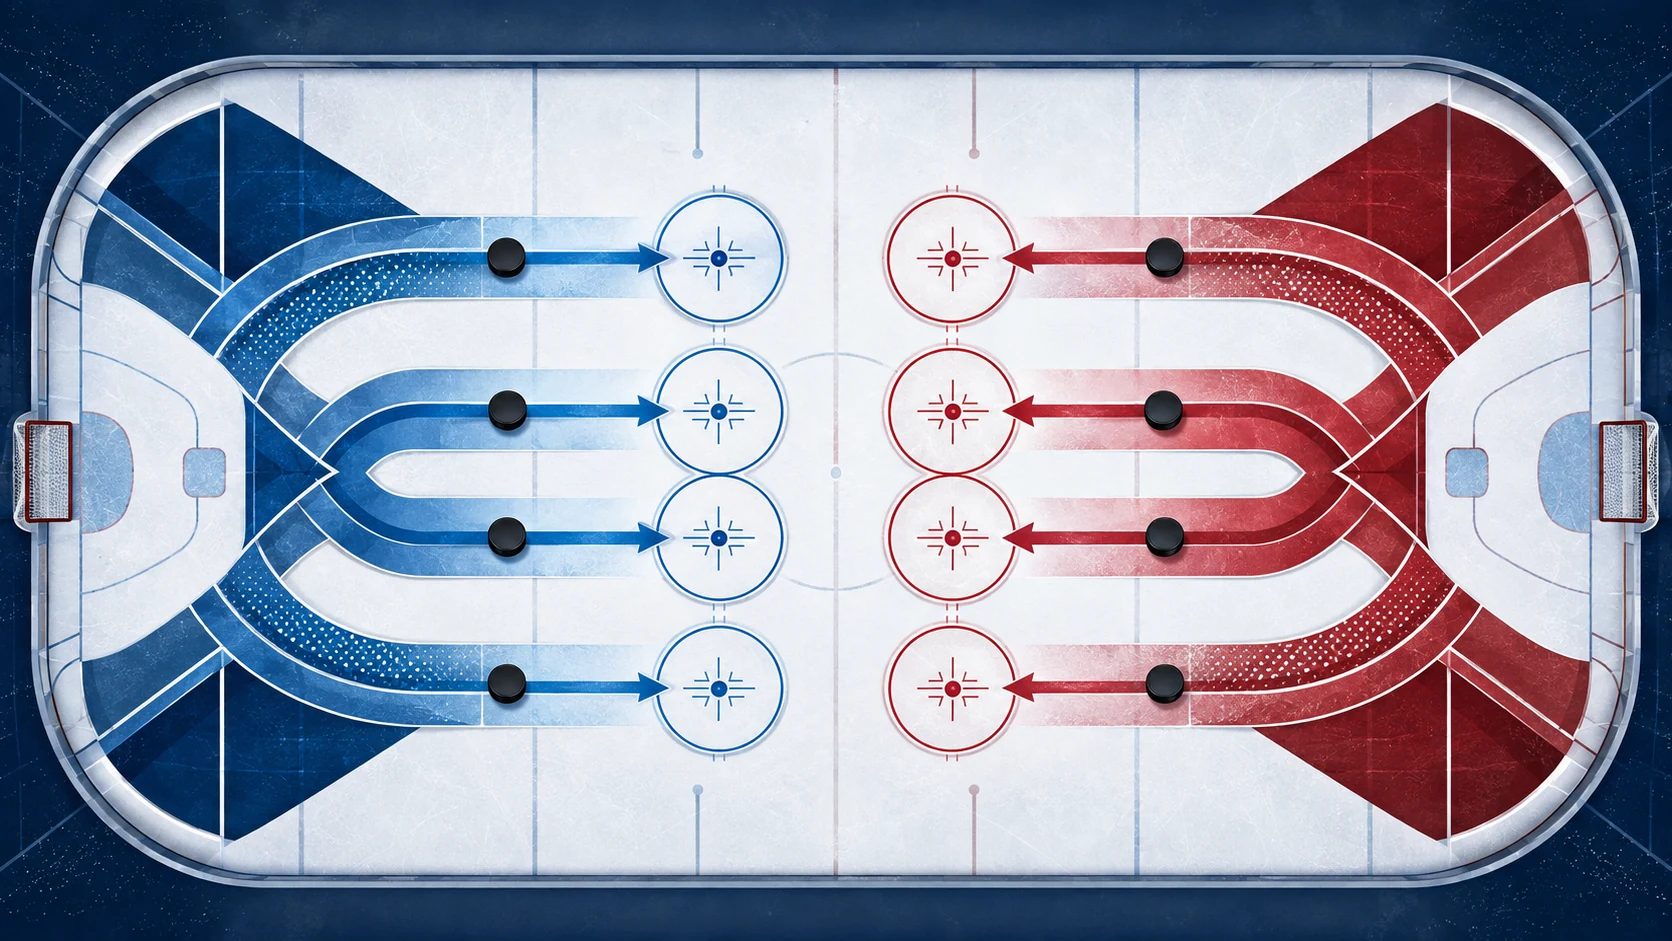
This is why the conference view alone can be misleading. A team may rank eighth in its conference and still sit outside if the division-based allocation puts another club in a guaranteed top-three position. Conversely, a club that is fourth in its division may be comfortably inside as WC1. Always read the division tables and wild-card table together.
The “playoff line” usually refers to the boundary below the final qualifying place. In a division table, the critical line is often below third. In a wild-card table, it is below WC2. A team can chase both routes late in the season: catch third place in its division or remain among the conference's two best non-top-three clubs.
Wild cards are not cross-conference. An Eastern team cannot take a Western place even if it has more points than a Western qualifier. The East and West each preserve eight berths, and the two conference champions do not meet until the Stanley Cup Final.
The NHL Playoff Tiebreakers in Exact Order
When two or more clubs have the same number of points, the NHL applies the following sequence. Stop as soon as one criterion separates them:
- Fewer games played, which means the superior points percentage.
- More regulation wins (RW).
- More regulation plus overtime wins (ROW).
- More total wins (W), including shootout wins.
- More points earned in head-to-head games, after applying the NHL's odd-game adjustment.
- Better goal differential (DIFF) over the full regular season.
- More goals for (GF) over the full regular season.
The games-played criterion matters only while teams have unequal schedules. If both clubs have completed the same number of games, their points percentages are also equal because their point totals are tied, so the comparison moves to RW.
RW and ROW are not the same number
RW counts only wins achieved in the 60-minute regulation game. ROW adds wins earned during the five-minute overtime period, but still excludes shootout wins. Total W includes every win. The order rewards teams that settled more games before overtime, then teams that settled more before a shootout.
Suppose two teams finish with 100 points in 82 games. Team A has 38 RW and 43 ROW; Team B has 37 RW and 45 ROW. Team A ranks higher because RW is checked before ROW. Team B's extra overtime wins never enter the decision.
How the odd-game head-to-head rule works
Head-to-head points sound simple until tied teams played an uneven number of games in one city. To prevent the club with the extra home date from benefiting unfairly, the NHL removes the first game played in the city that hosted the extra game. It then compares points from the remaining meetings.
For a tie involving more than two clubs, the league compares the percentage of available points earned among the tied teams, again excluding any applicable odd games. Only if that comparison still fails does the process move to season-long goal differential and goals scored.
One small scoring detail affects those last two steps: in the standings, a shootout win counts as one goal for and a shootout loss as one goal against. The actual shootout tally is not treated as a pile of goals.
Worked Examples: Reading the Cutoff Line Correctly
A standings table is easiest to read in layers. First check games played, because a club with fewer games may have the same points but a better points percentage. Next compare total points. Only when points are tied should you move through the official tiebreaker list. The two examples below use fictional teams and records; they illustrate the method, not a current playoff race.
Example 1: equal points, unequal games played
| Team | GP | PTS | P% | Position for now |
|---|---|---|---|---|
| Team North | 78 | 88 | .564 | Higher |
| Team South | 79 | 88 | .557 | Lower |
Team North is higher because it earned the same 88 points in one fewer game. The calculation is 88 divided by 156 available points, compared with 88 divided by 158. This is the practical meaning of a game in hand. It is an opportunity, not two points already won: after Team North plays its extra game, the teams may have equal GP, and ordinary points plus the remaining tiebreakers will determine the order.
Example 2: equal games and points
| Team | GP | PTS | RW | ROW | Position |
|---|---|---|---|---|---|
| Team Harbor | 82 | 96 | 35 | 39 | Higher |
| Team Ridge | 82 | 96 | 33 | 41 | Lower |
Team Harbor ranks higher because RW is checked before ROW. Team Ridge's larger ROW total cannot skip that earlier step. This is a common source of confusion when a broadcast graphic shows several win columns but does not explain their priority.
For a real race, use the same scan and then inspect this week's NHL schedule. Remaining opponents, back-to-backs and games in hand explain how quickly the cutoff can move, but they do not change the standings formula. The table records results already earned; the schedule shows the opportunities still available.
How Standings Become First-Round Matchups
Qualifying is only half the story. A team's final label—division winner, second or third in a division, WC1 or WC2—places it into a specific bracket lane. The NHL does not rank all 16 qualifiers from best to worst and pair them 1 through 16.
- The division winner with the better record in each conference plays WC2, the lower-ranked wild card.
- The other division winner in that conference plays WC1, the better wild card.
- The second-place team in each division plays that division's third-place team.
- The winners of the two series in the same division bracket meet in the second round.
That last point matters: the conference does not reseed after Round 1. If a wild card eliminates a division winner, it remains in that lane and plays the winner of the associated second-versus-third series. A lower regular-season seed therefore can host a later-round opponent only when the separate home-ice rules allow it; it does not jump to a new lane merely because another upset occurred.
Seed abbreviations make official brackets faster to read. A label such as 1A means first in the Atlantic Division, 2M means second in the Metropolitan Division, and WC1 means the better of the conference's two wild cards. Central and Pacific labels work the same way in the West. The number beside a division abbreviation is a division finish, not an overall league rank.
This design can create a strong second-versus-third matchup while a lower-point wild card faces a division champion elsewhere. That is intentional: the system protects division paths instead of creating a pure conference ranking. For the complete round structure, series length and bracket logic, use our complete NHL playoff format guide. This page stays focused on reading the standings that feed that bracket.
Clinched, Eliminated and Games in Hand: What the Labels Mean
Clinched means a position is mathematically secure. Even if the team loses every remaining game and its pursuers collect the maximum available points, the secured outcome cannot be taken away after the official tiebreakers are applied. A team may clinch a playoff berth first, then later clinch a top-three division position, a division title, a conference title or the league's best regular-season record.
Official NHL playoff-race material commonly uses status letters: X for a clinched playoff berth, Y for a division title, Z for a conference title and P for the Presidents' Trophy. Display conventions can differ by page or broadcaster, however, so read the legend supplied with the table. The word beside the symbol is more reliable than assuming every site uses the same capitalization or order.
Eliminated is the opposite mathematical threshold. It does not mean a team is merely unlikely to qualify. It means there is no remaining combination of its results and other clubs' results that can place it in a qualifying spot. Because three division places and two wild cards are evaluated inside each conference, elimination math may involve several races and tiebreakers rather than one simple target.
Why clinching scenarios can look complicated
An NHL game can produce a regulation winner and loser, or it can award two points to the winner and one to the overtime or shootout loser. That extra point changes what chasing teams can still reach. This is why an official clinching scenario may require a team to win in regulation, while another scenario works with any victory plus a rival's loss.
Games in hand add another layer. If Team A has two more points but has played two more games than Team B, Team B has four available points in those extra games—but none are guaranteed. Follow today's NHL games for immediate results, then use this week's NHL schedule to see when uneven games played may converge. Standings tell you what has happened; the schedule tells you when the race can change.
What Standings Decide About Home-Ice Advantage
Standings affect more than qualification and opponents. They also decide which team is scheduled at home first. In a standard best-of-seven series, the club with home-ice advantage hosts Games 1 and 2, then Games 5 and 7 if those games are necessary. The other club hosts Games 3 and 4, plus Game 6 if needed. This is the familiar 2-2-1-1-1 rotation.
During the first two rounds, home ice belongs to the team that placed higher in the regular-season standings. That wording matters inside a fixed bracket. Winning a first-round upset does not grant a wild card a new seed, and being called a division winner does not settle every possible later comparison by itself.
The rule becomes even clearer in the Conference Finals and Stanley Cup Final: the team with the better regular-season record receives home-ice advantage, regardless of where each team finished within its division. Imagine a wild card that earned 102 points and a division winner from the other bracket that earned 100. If they meet in the Conference Final, the 102-point club has the better regular-season record and hosts the opening games. The division-title label does not override that comparison.
Home-ice advantage is a scheduling right, not an extra win. Every series still requires four victories, and Games 5 through 7 exist only when the earlier results make them necessary. Once the league confirms postseason dates and start times, the full NHL schedule is the practical place to verify which building hosts each game. A standings table can explain why a team earned the preferred pattern; the published schedule confirms the actual date and time.
NHL Playoff Standings FAQ
How many teams qualify for the NHL playoffs?
Sixteen teams qualify: eight from the Eastern Conference and eight from the Western Conference. Each conference sends the top three finishers from both divisions plus its two best remaining teams as wild cards.
Is WC1 always the No. 7 team in its conference?
WC1 is the better of the two wild-card qualifiers, but it is not a pure 1-through-8 conference seed. Division positions are awarded first, so WC1 can finish with more points than a third-place team that qualified through the other division. Treat WC1 as a bracket label, not proof that the club had exactly the seventh-best conference record.
Is goal differential the first NHL tiebreaker?
No. When teams have equal points, fewer games played—equivalent to superior points percentage—comes first while schedules are uneven. RW, ROW, total wins and head-to-head results all appear before goal differential. Goals for is the final listed criterion.
Does a shootout win count in RW or ROW?
A shootout victory counts in total wins, but not in RW or ROW. RW excludes both overtime and shootout wins. ROW adds overtime wins but still excludes shootout wins. That is why two clubs with the same total victories can show different values in those columns.
Does the NHL reseed teams after the first round?
No under the current format. First-round winners stay in their assigned division-based bracket lane, and the two winners in that lane meet in Round 2. The Conference Final then brings together the two surviving bracket winners.
What breaks a tie in points?
Start with games played and points percentage, then follow the official sequence: RW, ROW, total wins, head-to-head results, goal differential and goals for. Stop as soon as one criterion separates the teams; do not jump directly to head-to-head or goal differential.
Once the standings have produced confirmed matchups, add the dates through the site's NHL calendar. The calendar tracks the games; the standings explain why those teams and host patterns were selected.
Comments
Comments are reviewed before publication. Spam, abusive content and policy-violating links are not published.
Sign in with Google to leave a comment.
Loading comments...