
Colorado ranks first in this edition of our 2026–27 NHL power rankings, narrowly ahead of Edmonton and Carolina. These are NHLSchedule.net's original data-based rankings, using editorially chosen weights rather than a vote or the official points order. Checked October 11, 2026, they include games through October 10. All 32 teams appear below, with the method and limitations explained before the list.
How Our NHL Power Rankings Work
A power ranking asks how teams compare beyond the points they have accumulated today. Our opening-season edition uses a deliberately simple strength index: last season's results provide an anchor, while this season's points percentage and goal balance show what has changed. The weights are our editorial choices. The score is a comparison scale, not a measured probability of winning a game or the Stanley Cup.
The Three Inputs and Their Weights
The formula is 100 × [0.50 × prior points percentage + 0.30 × current points percentage + 0.20 × goal-balance component]. Points percentage is points divided by twice games played. The goal component is 0.5 plus goal differential per game divided by four, after limiting that differential to a range of minus two to plus two. This makes a neutral goal balance 0.5 and keeps one extreme result from contributing an unlimited score.
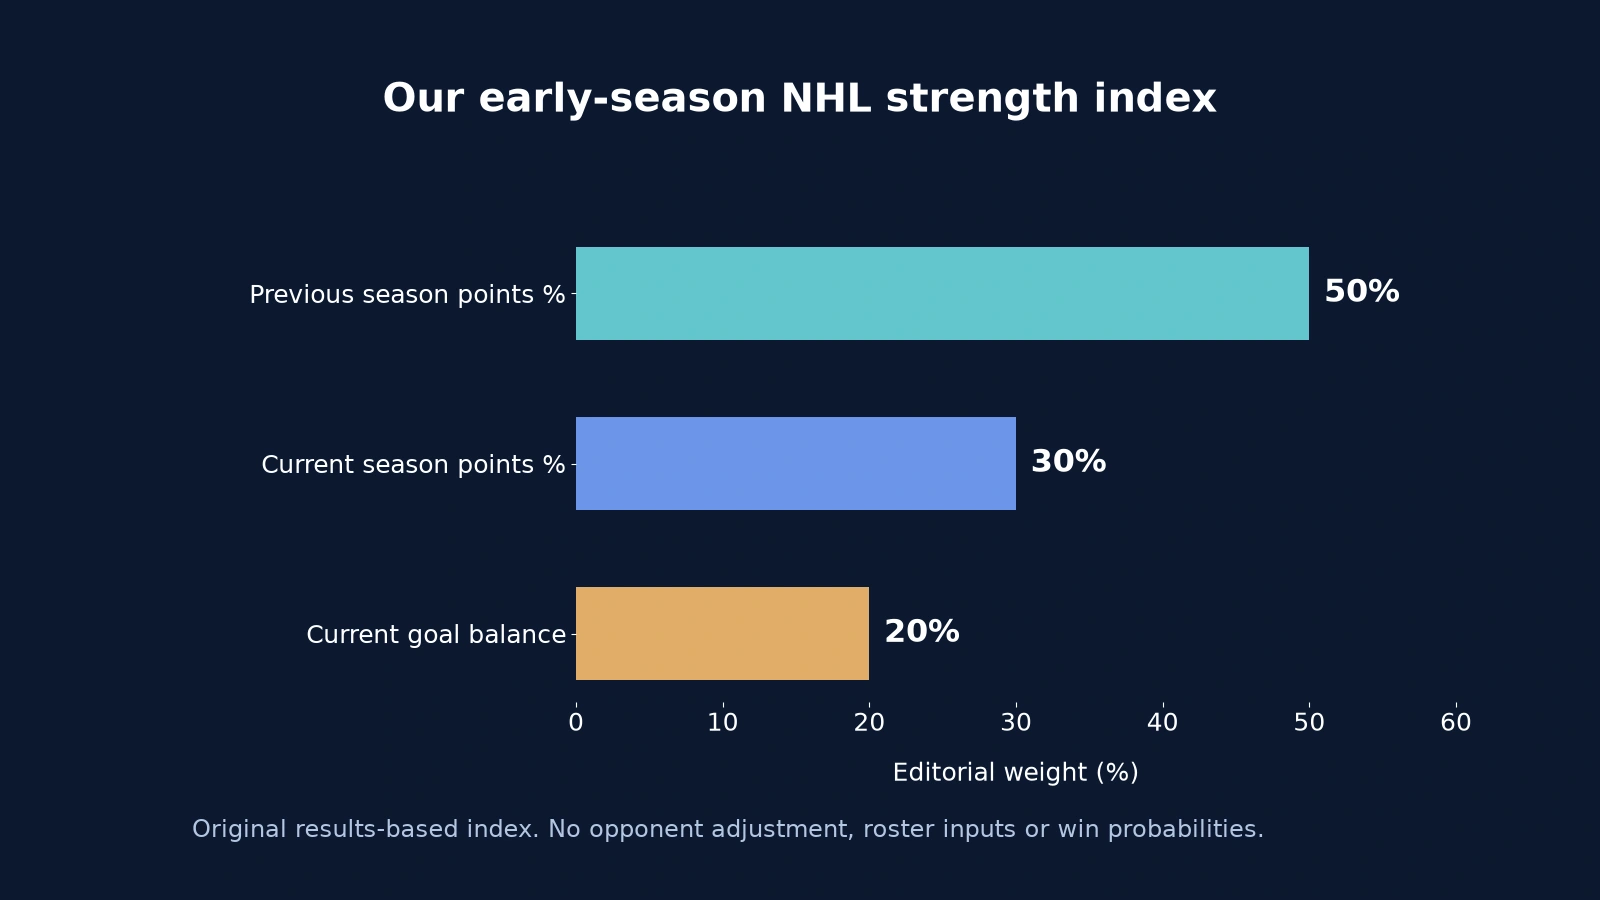
We use the official NHL standings data and the April 16, 2026 prior-season snapshot. Every team in that earlier sample played 82 games. The current season's longer schedule does not change the percentage calculation: the denominator uses games already played, not a full-season target.
For example, Colorado's previous 121 points produce a prior percentage of 121/164. Its current six points in five games produce 6/10, and a plus-nine differential produces 1.8 goals per game. Those inputs give an index of approximately 73.9. Teams are ordered on unrounded scores; equal displayed scores need not be exact ties. Exact ties would use current goal differential per game, then team name. Before a team plays, the current percentage defaults to 0.5 and goal differential to zero.
What the Index Does Not Measure
This is an accessible results-based index, not an opponent-adjusted model. It does not directly include injuries, roster changes, expected goals, starting goaltenders, travel or special-teams efficiency. Last season's record may lag a changed roster, and current goal differential includes game situations such as empty-net scoring. Read the team comments as interpretations of these inputs, not scouting claims about unmeasured factors.
The same limitation applies to a narrow rank gap. A fraction of an index point is not evidence that one team would reliably beat another. Early in the season, use the list to identify questions worth watching. For official qualification positions and tiebreakers, use the playoff-standings explanation.
Ranks 1–8: The Strongest Opening-Season Profiles
1. Colorado Avalanche — 73.9; record 3-2-0. Colorado's plus-nine goal balance and the strongest prior-season anchor overcome a less impressive current points percentage. This is the clearest example of why the index is not the standings table. The next test is turning that scoring margin into points consistently; the formula will not preserve first place indefinitely if the current record weakens.
2. Edmonton Oilers — 73.4; record 4-0-1. Edmonton has collected nine of ten available points and owns a plus-eight differential. Its current results do more work than its prior anchor in explaining this high position. Watch whether that combination survives a larger sample. A team earning points while maintaining a positive margin has two ways to support its rank, rather than relying only on last year's reputation.
3. Carolina Hurricanes — 72.8; record 4-1-1. Carolina combines a strong previous season with a positive start and a plus-seven margin. No single input has to carry the whole score. That balance is useful in an early edition: one ordinary result need not erase the profile. The distinction from the first two teams is small, and the index does not establish a meaningful separation in championship ability.
4. Vegas Golden Knights — 71.5; record 5-1-0. Vegas leads this snapshot in earned points, but the prior-season weight places it fourth here. A plus-nine margin supports the winning record rather than contradicting it. The question is how much of that early advantage remains as the schedule grows. Ranking below a team with fewer current points is a consequence of the stated method, not an unofficial standings penalty.
5. Tampa Bay Lightning — 70.3; record 4-1-0. Tampa Bay's eight points in five games build on a strong historical anchor. The plus-four margin is positive but less dramatic than several teams above it. Continued wins would help, while a wider scoring advantage would strengthen the second current-season input. The score does not tell us whether offense, defense or goaltending is chiefly responsible for those results.
6. Minnesota Wild — 68.7; record 3-1-1. Minnesota's plus-six margin adds useful support to seven points in five games. The index rewards that combination more than a raw points table alone would show. The next question is consistency across different game situations. A positive aggregate margin is encouraging, but it cannot establish the quality of the chances conceded or isolate any individual player's contribution.
7. Ottawa Senators — 68.2; record 4-1-0. Ottawa matches Tampa Bay's current record and plus-four differential. Their separation in this edition comes from the prior-season anchor. That is a visible editorial tradeoff: we preserve some longer-run evidence rather than declaring five games decisive. If Ottawa maintains its stronger current points percentage, later editions should explain clearly how the growing sample changes the interpretation.
8. Washington Capitals — 67.7; record 3-1-0. Washington's four-game sample is smaller than those of several neighbors. Its plus-five margin produces a strong per-game contribution, but a small denominator makes that input sensitive to the next result. Watch the Capitals' next few games together rather than isolating one score. A rank at the edge of this group is a snapshot of the index, not a fixed season tier.
Ranks 9–16: Positive Starts and Competing Signals
9. Anaheim Ducks — 67.0; record 4-1-0. Anaheim's plus-five margin and eight points offer a strong early combination. Its prior anchor is less powerful than those of some teams ahead, explaining why an identical win-loss record does not produce an identical rank. Watch whether the positive margin survives as games accumulate. Ninth is not a prediction of the Ducks' final league position.
10. Boston Bruins — 66.3; record 4-2-0. Boston benefits from a 100-point previous season and a plus-seven current differential. That larger anchor helps it stay close to teams with stronger early points percentages. The profile does not require describing the two losses as evidence of collapse. The useful test is whether the next stretch preserves both the positive margin and the rate of earned points.
11. Utah Mammoth — 63.9; record 4-2-0. Utah shares Boston's current record and plus-seven margin. The difference between them here is the previous season, not a hidden opinion about their players. That makes the comparison easy to audit. Watch Utah's own progress rather than treating the gap as a forecast that Boston would win a head-to-head game.
12. Dallas Stars — 62.1; record 2-2-1. Dallas' 112-point prior season keeps the score above teams with more impressive current records. A plus-three margin is encouraging, while five points from ten available show that the start has not matched the historical anchor. The index gives that longer record time to matter; it does not excuse an extended run of weaker current results.
13. Pittsburgh Penguins — 61.5; record 3-2-1. Pittsburgh has a positive margin and a current percentage relatively close to its prior one. This is a steadier numeric profile than a record driven entirely by one input. It does not prove the roster is unchanged or establish how the team will manage a full season. Watch for whether the positive differential persists alongside the points.
14. Seattle Kraken — 59.1; record 3-2-0. Seattle's plus-seven margin is a substantial early contribution despite a modest historical anchor. That separates the Kraken from teams earning similar points with a negative margin. The next few results will help show whether the advantage is durable. The formula cannot distinguish a broadly convincing performance from one large win without a game-by-game review.
15. New York Rangers — 58.5; record 4-2-0. The Rangers' present results are stronger than the prior-season component, with a plus-six margin reinforcing eight points. Their relatively lower position is a reminder that this edition deliberately resists replacing a longer sample overnight. A reader placing more weight on current games could reasonably prefer a higher rank, provided that weighting choice is made openly.
16. Nashville Predators — 54.2; record 2-1-2. Nashville has six points in five games with an even goal balance. The two overtime-loss points matter in the current percentage, but they are not wins. The next useful signal is whether the Predators begin generating a positive margin while continuing to collect points. Sixteenth here is simply an index position, not a playoff boundary.
Why Close Scores Need Context
Several teams sit within a small fraction of an index point of a neighbor. With only four to six games per team, a routine result can change their order. Read the score and the input pattern together. A rank gives an easy reference for discussion; it does not establish that the difference between adjacent clubs is large, stable or statistically meaningful.
Ranks 17–24: Teams with Something to Resolve
17. Winnipeg Jets — 54.0; record 3-1-1. Seven points make Winnipeg's record look stronger than its index position. The minus-two goal balance creates the competing signal, while the prior anchor is neutral. Watch whether continued point collection comes with a positive margin. The current discrepancy deserves attention, but five games cannot establish that the Jets' successful results are unsustainable.
18. Montréal Canadiens — 53.3; record 2-2-1. Montréal's strong previous season cushions a start with half the available points and a minus-four margin. The formula makes that cushioning visible instead of quietly changing expectations after every score. The Canadiens can improve both current inputs together by collecting points while strengthening goal balance. That is a more useful test than demanding an immediate return to last season's percentage.
19. Toronto Maple Leafs — 52.9; record 3-2-1. Toronto's seven points and plus-two margin exceed what its prior-season component alone would suggest. The current advantage is modest, so the rank remains close to several nearby teams. Watch whether the scoring balance improves with the points total. A higher standing in earned points is real; it simply answers a different question from this weighted comparison.
20. New York Islanders — 52.7; record 2-3-0. The Islanders have more losses than wins but a plus-three margin. That combination suggests why game outcomes and aggregate scoring are not the same measurement. The index retains some encouragement from the margin without treating it as a substitute for points. The next useful change would be moving the points percentage upward while preserving that positive balance.
21. Columbus Blue Jackets — 51.8; record 2-2-0. Columbus has a near-neutral current scoring picture: a minus-one differential across four games. Its prior season is the stronger component of the score. Because this is one of the smallest samples in the edition, one result can move both current inputs considerably. Watch a longer stretch before interpreting a small move in rank as a major team development.
22. Florida Panthers — 50.6; record 2-1-2. Florida's six points compete with a minus-three margin and a relatively modest prior anchor. Roster context also matters beyond the formula: the NHL reported Aleksander Barkov would miss six to eight weeks. That update is not an input here. Readers should consider current lineup information separately rather than assuming the index accounts for availability.
23. San Jose Sharks — 50.2; record 3-2-0. San Jose has a winning record alongside a minus-four differential. That disagreement pulls its index below the impression created by the wins alone. It does not identify which game or player explains the margin. Watch whether the Sharks continue winning while narrowing the gap between goals scored and conceded; those would be complementary improvements under the published method.
24. St. Louis Blues — 49.2; record 2-2-1. St. Louis sits near a neutral score, with half the available points and a minus-two margin. Its previous record offers some support but is not strong enough to overwhelm the current inputs. A short positive run can change the picture quickly. Look for improvement in both points rate and goal balance rather than treating one rebound win as a complete answer.
Ranks 25–32: Slow Starts and Recovery Tests
25. Buffalo Sabres — 47.2; record 2-3-0. Buffalo has one of the strongest prior anchors outside the top group, but its minus-eight current margin heavily offsets that support. The score shows why last season alone cannot answer the present question. The recovery test is collecting points with a narrower scoring deficit. Five games do not erase an entire previous season, but they do affect this edition.
26. New Jersey Devils — 46.5; record 2-2-0. New Jersey's even win-loss record comes with a minus-four margin across only four games. That small sample is important: one result changes the per-game inputs sharply. The prior anchor is close to neutral rather than dominant. Watch whether the Devils can establish a positive balance over their next stretch, not merely whether they win the next isolated game.
27. Detroit Red Wings — 42.0; record 1-3-1. Detroit has three points from ten available and a minus-five differential. Both current inputs pull against a better prior percentage. A useful recovery would improve the points rate while reducing the number of goals separating scored from conceded. The index cannot tell us whether lineup choices or tactics will produce that change; those require their own evidence.
28. Los Angeles Kings — 36.2; record 0-2-2. Los Angeles has earned two overtime-loss points but has not won in four games. Its minus-seven margin is another current concern. A first win would help the percentage, while a sustained improvement in scoring balance would support a broader recovery. Do not read two points as two victories or describe this tiny sample as a final verdict on the season.
29. Philadelphia Flyers — 34.9; record 0-4-2. Philadelphia's 98-point prior season offers a stronger anchor than several neighbors, but the current inputs are severe: two points in six games and a minus-seventeen differential. The goal component has reached its lower cap. That cap prevents unlimited damage to one part of the index; it does not make the current results acceptable or predict when they will improve.
30. Vancouver Canucks — 31.8; record 2-4-0. Vancouver's low prior percentage and minus-seven current margin both limit the score. Its two wins offer more current points than some teams immediately above and below, showing why this order differs from a simple win count. Watch for a positive scoring stretch that accompanies point collection. The numerical profile alone does not establish the pace of any roster development.
31. Chicago Blackhawks — 27.0; record 1-5-0. Chicago's minus-fourteen margin also reaches the formula's lower goal cap. The prior anchor and the current points rate explain the remaining score. The immediate test is competitive results across several games, with points as well as a narrower margin. A capped input is a mathematical design choice, not a reason to ignore further poor performances.
32. Calgary Flames — 23.5; record 0-5-0. Calgary has no earned points and a minus-nineteen margin in this snapshot. Those are the weakest combined current inputs, even after the goal component is capped. The first goal for a recovery is simple: start earning points while bringing the scoring balance closer to neutral. Last place in an October index is not mathematical playoff elimination.
How to Compare This List with Super 16 and Standings
Three lists can place the same team in three different positions without any of them containing a counting error. Standings record earned points under league rules. A panel expresses an informed collective opinion. Our index combines specified numerical inputs with editorial weights. Compare the question and the date before arguing about the resulting order.
Different Questions Produce Different Rankings
The NHL's Super 16 is a weekly voting-based ranking of sixteen teams. It can incorporate judgments that this simple index does not measure directly. Our all-team list is independently calculated; being seventeenth here does not mean a panel omitted that team, and being sixteenth does not grant a playoff place.
A playoff prediction asks a further question: who is likely to qualify after the remaining schedule? Conference and division competition matter to that answer. Our 2026–27 playoff predictions address that different task. This current comparison should not be relabeled as a projected bracket or a list of sixteen guaranteed qualifiers.
Use the Rankings to Choose Games, Not Predict Results
Use the list to find a contrast worth watching: a high-scoring margin against a team collecting points in close games, or a strong historical anchor against a club trying to establish a better current profile. Then check today's games or the week's matchups for an actual meeting. The schedule tells you when the comparison becomes a game.
Before drawing a conclusion about that matchup, check current lineups, goaltenders and other game information separately. None is silently included in the index. A score of 70 is not a 70 percent chance to win, and subtracting two scores does not create a betting edge. The method has not been calibrated to those tasks.
This is the first edition of this particular index, so there is no published last-week movement to report. Future editions should retain the same disclosed formula or explain a version change. Compare dated snapshots on that basis, and keep the team inputs beside the rank. That makes the discussion about what actually changed rather than a number moving without an explanation.
Comments
Comments are reviewed before publication. Spam, abusive content and policy-violating links are not published.
Sign in with Google to leave a comment.
Loading comments...